STA441s20
Assignment Six
Quiz on Monday February 24th in Tutorial. Bring a calculator with log and exponential functions.
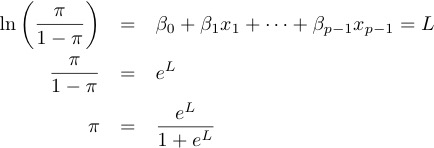
The following formulas will be provided with the quiz:
- If P(A) = 2/3, the odds of A equal _____.
- If P(A) = 1/4, the odds of A equal _____.
- If the odds of A equal x, the probability of A equals _____.
- If two events have equal probability, the odds ratio equals _____.
- If P(A) = 2/3 and P(B) = 1/5, te odds ratio of A to B is ______.
- For a multiple logistic regression model, if the value of the kth explanatory variable is increased
by c units and everything else remains the same, the odds of Y=1 are ______ times as great. Show the calculation of the odds ratio.
- Consider a logistic regression in which the cases are newly married couples with both people from the same religion, the explanatory variable is religion (A, B, C and None -- let's call "None" a religion), and the response variable is whether the marriage lasted 5 years (1=Yes, 0=No).
- Make a table with four rows, showing how you would set up indicator dummy variables for Religion, with None as the reference category.
- Add a column showing the odds of the marriage lasting 5 years. The symbols for your dummy variables should not appear in your formulas for the odds, because they are zeros and ones, and different for each row.
- What is the ratio of the odds of lasting 5 years or more for religion C to the odds of lasting 5 years or more for No Religion? Answer in terms of the β symbols of your model.
- What is the ratio of the odds of lasting 5 years or more for religion A to the odds of lasting 5 years or more for Religion B? Answer in terms of the β symbols of your model.
- You want to test whether Religion is related to whether the marriage lasts 5 years. State the null hypothesis in terms of one or more β values.
- You want to know whether marriages from Religion A are more likely to last 5 years than marriages from Religion C. State the null hypothesis in terms of one or more β values.
- You want to test whether marriages between people of No Religion have a 50-50 chance of lasting 5 years. State the null hypothesis in terms of one or more β values.
- Data are collected on university students who were looking for employment immediately following graduation. Three pieces of information are available for each student:
- Academic Division (Humanities, Sciences or Social Science)
- Final cumulative Grade Point Average
- Whether they were employed full time 6 months after graduation: Yes or No.
Consider a logistic regression model with no intercept, cell means coding, and GPA centered by subtracting off the mean for the entire sample.
- Make a table with three rows, showing how you would set up indicator dummy variables for Academic Division.
- Add a column showing the odds of being employed. The symbols for your dummy variables should not appear in your formulas for the odds, because they are zeros and ones, and different for each row.
- What is the ratio of the odds of being employed for a Humanities graduate to the odds of being employed for a Sciences graduate? Answer in terms of the β symbols of your model. Does this odds ratio depend on GPA? Answer Yes or No.
- What is the ratio of the odds of being employed for a Sciences graduate to the odds of being employed for a Social Sciences graduate? Answer in terms of the β symbols of your model. Does this odds ratio depend on GPA? Answer Yes or No.
- One grade point on a four point scale is pretty large. When GPA increases by one point, the odds of being employed are multiplied by _____. Answer in terms of the β symbols of your model. Does this odds ratio depend on Academic Division? Answer Yes or No.
- Controlling for GPA, you want to test whether students from the different academic divisions have different chances of finding a job. State the null hypothesis in terms of one or more β values.
- You want to know whether, controlling for Academic Division, the chances of finding a job depend on your marks. State the null hypothesis in terms of one or more β values.
- What is the probability of employment for a Sciences graduate with average GPA? Answer in terms of the β symbols of your model.
- Some people say that a Humanities graduate with average marks has no better than a 50% chance of finding work within 6 months of graduation. What null hypothesis would you use to test this claim? State the null hypothesis in terms of one or more β values.
- People who raise large numbers of birds inhale potentially dangerous material, especially tiny
fragments of feathers. Is this a risk factor for lung cancer, controlling for other possible risk factors? The file
birdlung.data.txt
comes from a wonderful book called The statistical sleuth by Ramsey and Schaefer. It is used here without permission. The variables are:
| 1. Lung Cancer |
1=Yes, 0=No |
| 2. Sex |
1=Female, 0=Male |
| 3. Socioeconomic Status |
1=High, 0=Low |
| 4. Birdkeeping |
1=Yes, 0=No |
| 5. Age |
|
| 6. Years smoked |
|
| 7. Cigarettes per day |
|
First, use proc means to generate basic descriptive statistics for the quantitative variables. Use proc freq to make frequency distributions of the binary variables, and also cigarettes per day.
- What percentage of people in the sample had cancer? Any comments?
- Based on the frequency distribution of number of cigarettes per day, how do you think the investigators obtained this information? For example, did they measure the nicotine in subjects' bloodstreams and estimate number of cigarettes based on that, or did they get the information some other way? Why do you think so?
- Is this an observational study, or experimental? Does the term "risk factor" imply causality? The
Wikipedia has a nice article on this.
- Do a logistic regression, with lung cancer as the response variable. Do not include any interactions, even though it's something you might investigate in a more thorough data analysis. Please answer the following questions using the model with all potential explanatory variables. Don't drop the ones that are non-significant. This is pretty arbitrary, but we all need to be doing the same thing.
- According to the model SAS is using, what is the log odds of cancer? Give the expression in symbols, with the correct number of explanatory variables.
- For each test in the default output, what is the null hypothesis in symbols?
- For each test in the default output, what is the value of the test statistic? The answer is a number.
- For each test in the default output, what is the p-value? The answer is a number.
- For each test in the default output, do you reject H0 at the 0.05 significance level? Answer Yes or No.
- For each test in the default output, are the results statistically at the 0.05 level? Answer Yes or No.
- For each test in the default output, what is your conclusion in plain, non-statistical language? Please avoid the term "risk factor." If you accept the null hypothesis you lose a point. If you merely assert the existence of a relationship when a directional conclusion is possible, you lose at least one point. If you state or imply a causal connection when there is no random assignment you lose at least one point. Fortunately you cannot lose more points than the total for the question.
- All other things being equal, the estimated odds of cancer for a participant of high socioeconomic status are ____ times as great.
- For a non-smoking, bird-keeping woman of average age and low socioeconomic status, what is the estimated probability of lung cancer? Do the calculation with proc iml so that the number appears on your printout.
- For a non-smoking, non-bird-keeping woman of average age and low socioeconomic status, what is the estimated probability of lung cancer? Do the calculation with proc iml so that the number appears on your printout.
Please bring your log file and your results file to the quiz. Bring a calculator.

This assignment is licensed under a Creative Commons Attribution-ShareAlike 3.0 (or later) Unported License. Use and share it freely.