Assignment Five: Quiz
on Monday Feb. 10th in tutorial
This assignment is SAS only. Please bring a calculator to the quiz, as well as your log file and results file. For each test on your results file, be able to answer these questions:
- What is E(y|x) for the model SAS is using?
- What is the null hypothesis, in symbols?
- Do you reject H0 at the 0.05 significance level? Answer Yes or No.
- In plain, non-statistical language, what do you conclude?
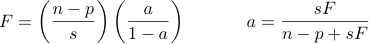
The following formulas will be provided if necessary:
In the job satisfaction and diversity study, employees at Canadian corporations filled out questionnaires about their jobs. Questionnaires employed 5-point scales, where 5 indicates the highest level of the trait or opinion being assessed (like job satisfaction) and 1 indicating the lowest level. The wording of the questions was varied so that sometimes a 1 indicated higher satisfaction (for example, strong disagreement with "I hate my job."), but the numbers were switched around so that in the data file, larger numbers always indicate more. Data consist of answers to
- Ten questions about committment (loyalty) to the organization, with higher numbers indicating more committment.
- Five questions about relations with colleagues at work, with
higher numbers indicating better relations.
- Twelve questions about relations with magnagement, in particular
the respondent's immediate boss. Higher numbers indicate better
relations.
- Six questions about fair opportunities for advancement, with
higher numbers indicating more fairness.
- Four questions about job satisfaction, with higher numbers
indicating more satisfaction.
- Three questions about senior management's committment to
diversity, with higher numbers indicating more committment.
- Gender: 0=Male, 1=Female
- Visible Minority status: 0=No, 1=Yes. This term is ambiguous, especially in Toronto.
I believe it is intended to be a polite way to say whether you look European or not.
- Education level, numbered 1-7. The exact meanings of the numbers are unknown, but surely higher numbers must indicate more education, at least mostly.
- Marital status: 1=never married, 2=married, 3=divorced or
separated, 4=widowed. This is a guess, but I'm fairly confident.
- Age in years
- Born outside Canada: 0=No, 1=Yes
There are two data sets, and exploratory sample and a replication sample. The exploratory data are available in the Excel spreadsheet
DiversityExplore.xlsx. The replication data are in DiversityReplic.xlsx.
These are real data. They are professionally cleaned, but don't take anything for granted. Open the spreadsheet and look at in in Excel (or in Open Office, if you refuse to use Microsoft products). Do you see anything unusual? We will get back to this later.
- Read the data and take a look at frequency distributions of everything. I see something funny about the job satisfaction items; do you? Please do not include these frequency distributions in the results file you bring to the quiz. My proc freq is commented out.
- Create the following variables by adding the scores on individual questionnaire items. We will treat these as quantitative.
- Commitment to the organization
- Relations with colleagues at work
- Relations with magnagement
- Fair opportunities for advancement
- Job satisfaction
- Senior management's commitment to diversity
Some handy SAS syntax for this is sum(of com1-com10).
- We are also going to treat age (and even education, in some analyses) as quantitative. The problem is that as you noticed when you looked at the Excel spreadsheet, missing values were coded as blank. This is quite natural. But it caused caused Excel to make any column with missing values character-valued rather than numeric, and then in proc import, SAS believes Excel. This is also quite natural, but if age is character-valued, you can't do numerical calculations on it. You need to convert age (and maybe other variables) to numeric. I didn't remember how to do this, so I searched sas convert character to numeric. This was pretty easy, and good to know.
- Make a new variable, an indicator for whether the person is married or not. Not married includes separated, because we have no choice. Of course it should be numeric so you can use it in a regression. Be careful about missing values.
- Make frequency distributions of the categorical variables, not including the individual questionnaire items you added up. Also, use proc means to get basic statistics on the quantitative variables. The quantitative variables are the ones you created by adding up questionnaire items, plus age and education.
Education is both categorical and quantitative. You should be able to answer questions like
- How many respondents were never married?
- What percentage were born outside Canada?
- What is mean job satisfaction? (My answer is 14.788)
- How many missing values were there for education?
Variable labels and proc format are not required, but they are a good idea. If you cannot remember what the variables are or what the variable values mean, nobody is going to tell you during the quiz.
- Out of the many possible analyses involving the categorical variables, test the association between sex and whether or not the person is married. More than one test statistic is produced by default. We'll take the first one, the common Pearson chi-squared test of independence; the formula was given in the first slide show, but you won't need the formula. If these results are significant, you will be able to draw a directional conclusion by comparing the percent married for men and women.
- Use proc corr to obtain a correlation matrix of the quantitative variables, and be able to interpret any correlation that is significant. If you have not seen proc corr yet in lecture, there is an example in Chapter Two or you can look it up online.
- Using proc means, obtain mean education for minority and non-minority respondents. Test for significance using either proc glm or proc reg (or both if you really feel like it), ignoring all other potential explanatory variables. What proportion of the variation in education is explained by visible minority status? Describe the results in plain, non-statistical language.
- Now run a big regression in which job satisfaction is the response variable, and the explanatory variables are Relations with colleagues at work, Relations with magnagement, Fair opportunities for advancement, Senior management's commitment to diversity, Sex, Visible minority status, Education (treated as quantitative), Whether or not the respondent is married, Age, and Whether or not the respondent was born outside Canada. After looking at the t statistics, carry out a single test of the variables that were non-significant. This means run the regression once, and then add a test statement to the code and run it again.
- What proportion of the remaining variation is explained by the non-significant variables? You can do it with proc iml or with a calculator, but in any case it's something you should be able to do with a calculator for any F-test or t-test on your printout.
- Now fit a model with just the four significant explanatory variables. Be ready to interpret the results of each test, calculate proportions of remaining variation, and so on.
- Why is the following conclusion unjustified? Allowing for relations with management, perceived fairness in opportunities for advancement and visible minority status, good relations with colleagues at work lead to more job satisfaction.
- The delicious phrase "Bonferonni-corrected cross-validation" means that after an exploratory analysis has identified a collection of conclusions backed up by significant results, you take a second, independent sample from the same population and test only the hypotheses that supported your final conclusions in the exploratory analysis. You protect this replication set at the joint 0.05 significance level with a Bonferroni correction. That is, you will say that a result is replicated (so you actually believe it) if p < 0.05/k on the replication data.
Using DiversityReplic.xlsx, carry out this procedure on the tests for the four variables that worked in the exploration phase. Do this in the same SAS program as the rest of the assignment. What are your final conclusions?
Bring your log and results files to the quiz. Do not write anything
on the printouts in advance except your name and student number. You may be
asked to hand them in. The log and list files must
be generated by the same SAS program. There
must be no errors or warnings in your log file. Bring a calculator to the quiz.

This assignment is licensed under a Creative Commons Attribution-ShareAlike 3.0 (or later) Unported License. Use and share it freely.