STA441s18 Assignment Six
Quiz on Tuesday February 27th in Tutorial.
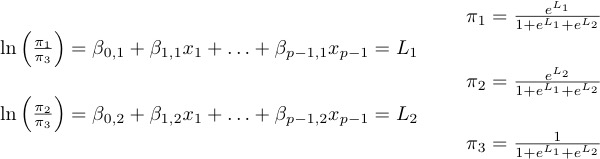
The following formulas will be provided with the quiz if necessary:
- In the Heart attack data, a sample of middle-aged men who had heart attacks were classified into three groups. Either they died of the first heart attack, or they died during the next 10 years, or they were still alive 10 years after the first attack. This is the response variable. Potential explanatory variables include
age = x1, blood pressure = x2, and family history of heart disease (Yes-No) = x3. Let's just consider these for now. For interpretability, make the probability of being alive 10 years later the denominator in each generalized logit.
- Write the multinomial logit model for these data. How many generalized logits do you have? Of course you must have a regression equation for each one. There are no interactions.
- Make a table with two rows, one for Family history = Yes, and one for Family history = No. In each row, write two probability ratios. Let's call then "relative risks." The relative risk of dying in a particular way is the probability of dying that way divided by the probability of living.
- Controlling for age and blood pressure, the relative risk of dying in the first heart attack is _______ times as great for those with a family history of coronary heart disease.
- Controlling for age and blood pressure, the relative risk of dying in the next 10 years after the first heart attack is _______ times as great for those with a family history of coronary heart disease.
- For a patient with no family history of heart disease, what is the probability of dying from the first heart attack? Answer in terms of Greek letters from your model, and also x1 and x2.
- Sad to say, we have no idea what happens to most of our students after they graduate. So imagine the following. Six months after graduation, U of T students are classified as follows: working in a job related to their area of study, working in a job unrelated to their field of study, more school, and unemployed. We seek to predict this outcome from final cumulative Grade Point Average and academic division (Humanities, Science, or Social Science).
- Write the equations of a generalized logit model for these data. There should be an intercept in each equation, and no interactions. Denote GPA by x .
- Make a table showing how the dummy variables for academic Division are defined. Make Science the reference category.
- The reference category for the response variable (corresponding to the denominator of the generalized logits) will be unemployed, so that relative probability means the probability of an outcome divided by the probability of being unemployed. In your model, what do the symbols π1, π2, π3 and π4 represent?
- Holding GPA constant, the relative probability of being in school (again, still) is _____ times as great for Humanities graduates as for Science graduates. Answer in terms of a Greek letter or letters from your model.
- Allowing for marks, the relative chances of being employed in a job related to their field of study (as opposed to unemployed) is _____ times as great for Social Science students as for Science students. Answer in terms of a Greek letter or letters from your model.
- State the null hypothesis you would test in order to answer this question: Allowing for what academic division they were in, is GPA related to what students are doing 6 months after graduation?
- State the null hypothesis you would test in order to answer this question: Controlling for GPA, do students from the different academic divisions tend to be doing different things 6 months after graduation?
- State the null hypothesis you would test in order to answer this question: Correcting for final gradepoint average, who is more likely to be going to school 6 months after graduation, Social Science students, or Humanities students? The answer this question is what you might guess, but to see it, make a table showing the relative probability of being in school for students from the three academic divisions.
- What is the probability that a Science graduate will be unemployed 6 months after graduation. Answer in terms of Greek letters from your model, and also x. I know the answer is long -- sorry about that!
- The file
heart.txt
contains data from a long-term study of middle-aged male employees of the Western Electric Company in the 1950's. The first part of the file gives descriptions of the variables. This part should be stripped off or skipped using the firstobs option on the infile statement.
Write a SAS program that reads and labels the data, including a
proc format. This data file contains numeric missing value codes; 99, 999 and so on. You should convert them to the SAS missing value code using if statements (not a text editor!). Also create a new variable with 3 categories:
- Died from first heart attack (Sudden Death or Fatal Myocardial Infraction)
- Died in next 10 years
- Alive 10 years later
First, do the following. This material should be included in the printout you bring to the quiz.
- using proc means, obtain means and standard deviations of all the quantitative variables; this includes number of cigarettes. I got a mean years of education equal to 11.6603774.
- Obtain frequency distributions of the categorical variables, including the new 3-category variable you created. It seems that 13 people died on Friday.
- Look at a table of first coronary heart disease event by whether or not the person has coronary heart disease. Suppress all the percentages and include the missing values. Does the table look okay? If so, relax. If not, track down any problems and fix them using common sense.
- To check the 3-category variable you created, make a table of the new variable by "First coronary heart disease event."
- Now carry out an analysis in which the new 3-category variable you created is the response variable. For interpretability, make the probability of being alive 10 years later the denominator in each generalized logit. The explanatory variables will be Age, Blood pressure, Number of cigarettes and Family history of coronary heart disease.
- Fit the model with proc logistic. To "fit" a model means estimate the parameters. I get b0,2 = -14.2147.
- Write the model SAS is using, in Greek letters.
- For every test on the default output, be able to state the null hypothesis in Greek letters, and give the value of the test statistic and the p-value (numbers from the printout). State whether the results are statistically significant, whether you reject the null hypothesis, and what (if anything) you'd conclude. For the conclusion, use plain, non-statistical language. Why does it make sense that both regression coefficients for age are positive?
- Carry out a test of Number of cigarettes and Family history of CHD (considered simultaneously -- one test) controlling for Age and Blood pressure. Be able to state the value of the test statistic and the p-value (numbers from the printout), as well as whether the results are statistically significant, whether you reject the null hypothesis, and what (if anything) you'd conclude. For the conclusion, use plain, non-statistical language.
- Based on the results you just obtained, fit a model with just Age and Blood pressure. For a 50 year old with a diastolic blood pressure of 100, estimate the probability of
- Dying from a first heart attack.
- Dying in the following 10 years.
- Being alive 10 years later.
Use proc iml. Should your probabilities add to one? For a 5 year old with disastolic blood pressure equal to 400, I get the following estimated probability of being alive 10 years later: 0.0057949.
Please bring your log file and your results file to the quiz.

This assignment is copyright Jerry Brunner, 2018. It is licensed under a Creative Commons Attribution-ShareAlike 3.0 (or later) Unported License. Use and share it freely.