Assignment Four: Quiz
on Thursday Feb. 4th in tutorial
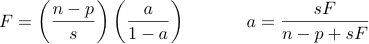
This assignment is based on material in Chapter 5 of the online text, and associated lecture material. The following formulas will be provided with the quiz (and the final exam), whether they are needed or not:
- High School History classes from across Ontario are randomly assigned to either a discovery-oriented or a memory-oriented curriculum in Canadian history. At the end of the year, the students are given a standardized test and the median score of each class is recorded. Please consider a regression model with these variables.:
- X1: Equals 1 if the class uses the discovery-oriented curriculum, and equals 0 the class it uses the memory-oriented curriculum.
- X2: Average parents' education for the classroom
- X3: Average parents' income for the classroom
- X4: Number of university History courses taken by the teacher
- X5: Teacher's final cumulative university grade point average
- Y : Class median score on the standardized history test.
The full regression model is
E[Y|X] = β0 + β1X1
+ β2X2 + β3X3
+ β4X4 + β5X5.
For each question below, please give the null hypothesis in terms of β values. Also, give E[Y|X] for the reduced model you would use to answer the question. Don't re-number the variables.
- If you control for parents' education and income and for teacher's university background, does curriculum type affect test scores? (And why is it okay to use the word "affect?")
- Controlling for parents' education and income and for curriculum type, is teacher's university background (two variables) related to their students' test performance?
- Controlling for teacher's university background and for curriculum type, are parents' education and income (considered simultaneously) related to students' test performance?
- Controlling for curriculum type, teacher's university background and parents' education, is parents' income related to students' test performance?
- The U.S. Census Bureau divides the United States into small pieces called census tracts; lots of information is collected about each census tract. The census tracts are grouped into four geographic regions: Northeast, North Central, South and West. In one study, the cases were census tracts, the explanatory variables were Region and average income, and the response variable was crime rate, defined as the number of reported serious crimes in a census tract, divided by the number of people in the census tract.
- Write E(Y|x) for a regression model with parallel regression lines. You do not have to say how your dummy variables are defined. You will do that in the next part.
- Make a table showing how your dummy variables are set up. There should be one row for each region, and a column for each dummy variable. Add a wider column on the right, in which you show E(Y|x) for each region. Note that the symbols for your dummy variables will not appear in this column. There are examples of this format in the lecture slides and the text.
- For each of the following questions, give the null hypothesis in terms of the β parameters of your regression model. Remember that we are not doing one-tailed tests in this class.
- Controlling for income, does average crime rate differ by geographic region?
- Controlling for income, is average crime rate different in the Northeast and North Central regions?
- Controlling for income, is average crime rate different in the Northeast and Western regions?
- Controlling for income, is the crime rate in the South more than the average of the other three regions?
- Controlling for income, is the average crime rate in the Northeast and North Central regions different from the average of the South and West?
- Controlling for geographic region, is crime rate connected to income?
- This question uses the
Furnace data of
Assignment Three. The main
purpose of this study is to see which kind of vent damper uses more energy,
thermally activated or electrically activated. The vent damper can't do
anything when it's inactive (out), but still energy consumption with vent
damper active is strongly related to energy consumption with vent damper
inactive. That's because a huge number of important unmeasured variables
(insulation, exposure to the wind, total surface area, efficiancy of the
furnace, how much heat the residents like, etc.) are identical for the two
measurements, because it's the same house. So, let's take energy
consumption with vent damper in as the response variable. We'll use
energy consumption with vent damper out (inactive) as a covariate, and see
what else matters.
Note that in this question, there are no interactions. We'll
get to that later.
- First, use proc reg to fit a regression model in which energy consumption with vent damper out is the only explanatory variable. What proportion of the variation does it explain?
- Make indicator dummy variables for the following categorical explanatory variables. You should check to make sure you did it right, but you need not print the frequency tables.
- Type of Furnace: Forced water is reference category
- Chimney Shape: Rectangular is reference category
- Chimney Liner: Unlined is reference category
- House Type (all 5 categories): Ranch is reference category
- Type of Vent Damper (1=EVD)
For each of these variables, use proc reg to test whether it is related to energy consumption with vent damper in, once you control for energy consumption with vent damper out. Be able to
- Give the value of the test statistic (t or F), the p-value, and whether the results are statistically significant.
- Calculate the proportion of the remaining variation in the response variable that is explained by the categorical variable, once energy consumption with vent damper inactive is taken into account.
- State your conclusions (if any) in plain, non-statistical language. Make sure you cannot be accused of accepting the null hypothesis.
Check your work with proc glm. Agaain, you are considering each of these categorical explanatory variables one at a time, controlling for energy consumption with vent damper out, but not controlling for each other, yet.
- Consider the last item, Type of vent damper controlling for energy consumption with vent damper inactive. Please obtain the least squares means as part of your proc glm output. Be able to reproduce the least squares means (using a calculator) from your proc reg output.
- Using proc reg, fit a full model. The explanatory variables are Energy consumption with vent damper inactive, Chimney area, Chimney height, Age of house, and dummy variables for the categorical explanatory variables of Question 2. Test each variable controlling for all the others. For the categorical explanatory variables with more than two categories, this means using the test statement. Be able to give the value of the test statistic, proportion of remaining variation, the p-value, and whether the results are statistically significant. Be able to state your conclusions (if any) in plain, non-statistical language. Make sure you cannot be accused of accepting the null hypothesis. It would be wise to check your work with proc glm.
- Starting with the full model from the last question, try stepwise selection with the significance level for entry to the model and significance level for staying in the model both equal to 0.05. You are responsible for understanding all the output except C(p). What model do you arrive at?
- Now do the same, except using selection = backward instead of selection = stepwise. Does this suggest a different model?
- Based on the results of the backward variable selection, fit a model in which Energy consumption with vent damper active depends on Energy consumption with vent damper inactive, Chimney area, and Type of chimney liner. This is the full model for the following questions. If you start with proc reg simple, you will get simple descriptive statistics that will be useful later. Here's the question: Controlling for Energy consumption with vent damper inactive and Chimney area, is Type of chimney liner related to Energy consumption with vent damper active?
- Give the value of the test statistic. The answer is a number from the printout.
- What is the p-value? The answer is a number from the printout.
- Do you reject the null hypothesis at α=0.05? Answer Yes or No.
- Are the results statistically significant at the 0.05 level? Answer Yes or No.
- After allowing for Energy consumption with vent
damper inactive and Chimney area, what proportion of
the remaining variation in Energy consumption with vent
damper active is explained by Type of chimney liner?
The answer is a number between zero and one. Show a
little work.
- Using regression output, calculate three least
squares means, one for each type of chimney liner.
- Based on proc reg output, carry out all
pairwise comparisons of means for the three types of
chimney liner. Use a Bonferroni correction. Calculate
all the Bonferroni-corrected p-values.
- In simple, non-technical lnguage, what do you
conclude? Include a statement that (allowing for ...)
houses with certain types of chimney liner use (more,
less) energy.
- Check your least squares means and
Bonferroni-corrected p-values with proc glm.
Bring your log and results files to the quiz. Do not write anything
on the printouts in advance except your name and student number. You may be
asked to hand them in. The log and list files for each data set must
be generated by the same SAS program or you may lose a lot of marks. There
must be no errors or warnings in your log files. There must be no
notes about invalid data. Bring a calculator to the quiz.