Personality and Job Satisfaction
First illustrate matrix output from proc corr and matrix input to proc calis. Verify that matrix input and raw data input yield the same results.
/************************ MatrixExample1.sas ****************************/
title 'Illustrate matrix input to proc calis';
title2 'Jerry Brunner:  Student Number 999999999';

data baby; /* Baby double measurement data */
     infile '/folders/myfolders/431s17/Babydouble.data.txt'
             firstobs=2;
     input id W1 W2 Y;

/* The following syntax says
   Read from the data table called baby,
   Don't print simple statistics (means etc.),
   Print sample covariances rather than correlations,
   Create an output data table called SigmaHat,
   (It's a covariance matrix),
   No correlations in the output data table please. */

proc corr data=baby nosimple
          cov vardef=n
          out = SigmaHat(type=cov) nocorr;
     var W1 W2 Y;

proc print data = SigmaHat;
     title3 'Take a look at SigmaHat';

proc calis data=SigmaHat vardef=n nostand pshort;
 	 title3 'Matrix input';
     fitindex on(only) = [chisq df probchi];
     var W1 W2 Y;
     lineqs
        Y  = beta1*F + epsilon,
        W1 = F + e1,
        W2 = F + e2;
     variance
        F = phi, epsilon = psi, e1=omega1, e2=omega2;

proc calis data=baby vardef=n nostand pshort;
 	 title3 'Raw data input';
     fitindex on(only) = [chisq df probchi];
     var W1 W2 Y;
     lineqs
        Y  = beta1*F + epsilon,
        W1 = F + e1,
        W2 = F + e2;
     variance
        F = phi, epsilon = psi, e1=omega1, e2=omega2;
Personality and Job Satisfaction
/************* JobSatisfaction.sas *****************/
title 'Personality, Job Satisfaction and Performance';
/* Published reliabilities are used to identify the measurement model, with
matrix input. These numbers were assembled from various published sources.
Pretend they are from a single study with n=724.
Extra = Exraversion
Neuro = Neurotocism
ITQ = Intention to Quit
Satis = Job Satisfaction
Perf = Job Performance
*********************************************************************/
data adjusted(type=cov); /* Adjusted sample covariance matrix */
input _type_ $ _name_ $ Extra Neuro ITQ Satis Perf;
datalines;
cov Extra 22.7392 -7.3700 -4.480 15.3500 2.5700
cov Neuro -7.3700 8.5956 7.250 -8.5500 -1.8100
cov ITQ -4.4800 7.2500 53.664 -45.9600 -5.7800
cov Satis 15.3500 -8.5500 -45.960 112.0612 16.5000
cov Perf 2.5700 -1.8100 -5.780 16.5000 31.9644
n . 724 724 724 724 724
;
/* Sample covariance matrix was adjusted by multiplying variances
by reliabilities, producing estimated covariance matrix
of the latent variables: Phi-hat. For the record, the
reliabilities from the published literature were
Extra Neuro ITQ Satis Perf
0.76 0.58 0.80 0.82 0.52
*/
proc print;
title2 'Look at the adjusted sample covariance matrix';
proc calis vardef=n nostand pshort data=adjusted;
title2 'Covariance matrix adjusted for measurement error';
fitindex on(only) = [chisq df probchi];
/* var may be used to analyze a subset of the variables. */
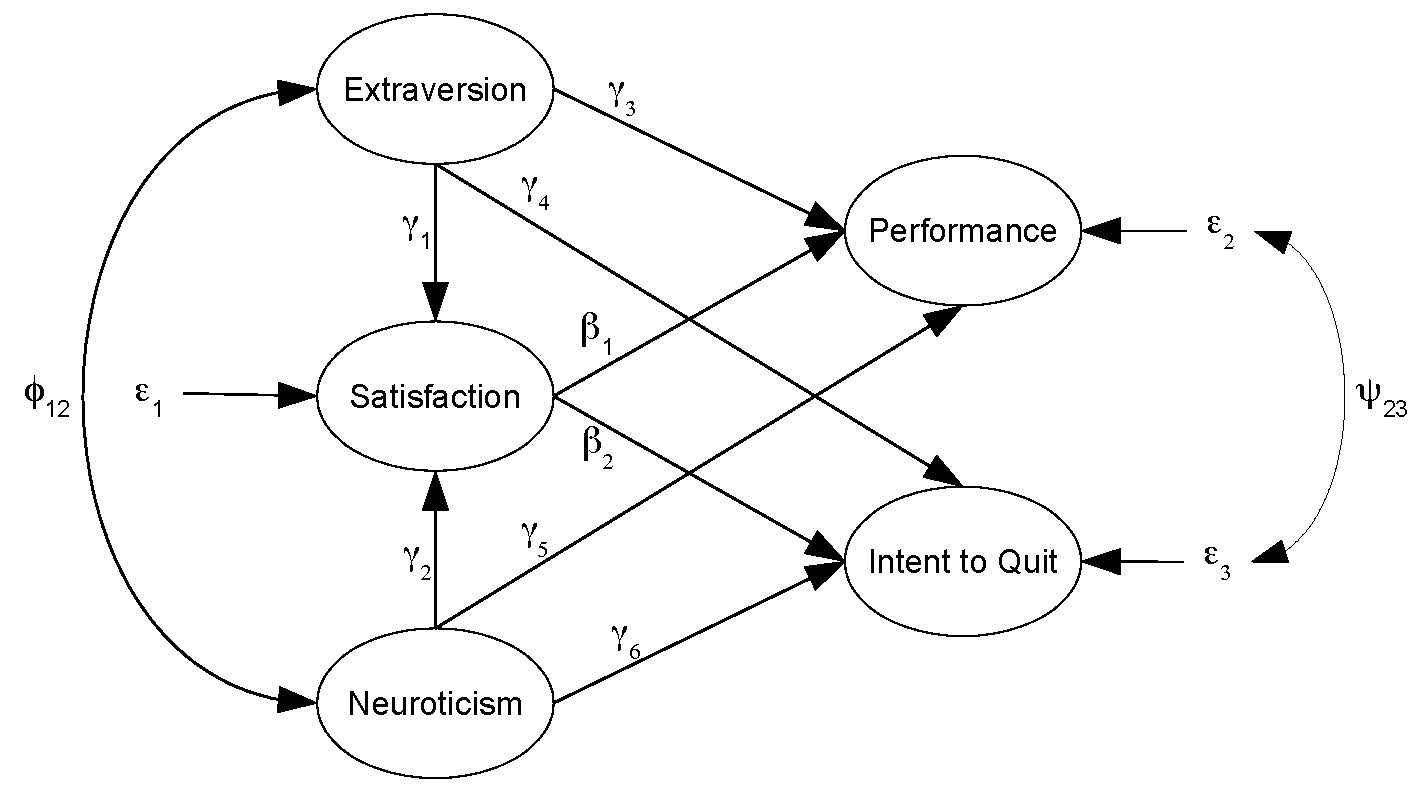
lineqs /* A latent variable model, though SAS doesn't know it. */
Satis = gamma1*Extra + gamma2*Neuro + epsilon1,
Perf = gamma3*Extra + gamma4*Neuro + beta1*Satis + epsilon2,
ITQ = gamma5*Extra + gamma6*Neuro + beta2*Satis + epsilon3;
variance
Extra=phi11, Neuro=phi22, epsilon1-epsilon3 = psi1-psi3;
cov
Extra Neuro = phi12, epsilon2 epsilon3 = psi23;
bounds 0.0 < phi11 phi22 psi1-psi3;
/* Compare analysis of the unadjusted covariance matrix. */
data Sigmahat(type=cov); /* Unadjusted sample covariance matrix */
input _type_ $ _name_ $ Extra Neuro ITQ Satis Perf;
datalines;
cov Extra 29.92 -7.37 -4.48 15.35 2.57
cov Neuro -7.37 14.82 7.25 -8.55 -1.81
cov ITQ -4.48 7.25 67.08 -45.96 -5.78
cov Satis 15.35 -8.55 -45.96 136.66 16.50
cov Perf 2.57 -1.81 -5.78 16.50 61.47
n . 724 724 724 724 724
;
proc calis vardef=n nostand pshort data=Sigmahat;
title2 'Surface path analysis of unadjusted covariance matrix';
fitindex on(only) = [chisq df probchi];
/* var may be used to analyze a subset of the variables. */
lineqs /* A latent variable model, though SAS doesn't know it. */
Satis = gamma1*Extra + gamma2*Neuro + epsilon1,
Perf = gamma3*Extra + gamma4*Neuro + beta1*Satis + epsilon2,
ITQ = gamma5*Extra + gamma6*Neuro + beta2*Satis + epsilon3;
variance
Extra=phi11, Neuro=phi22, epsilon1-epsilon3 = psi1-psi3;
cov
Extra Neuro = phi12, epsilon2 epsilon3 = psi23;
bounds 0.0 < phi11 phi22 psi1-psi3;
Plain Language Summary
There is evidence that personality affects job satisfaction. More extraverted employees are more satisfied on average, while more neurotic employees tend to be less satisfied. Job satisfaction has a beneficial effect on performance, with, more satisfied employees tending to receive higher performance evaluations. While personality affects job performance indirectly through job satisfaction, there is no evidence of a direct effect of personality on job performance.
Naturally, employees who are more satisfied with their jobs tend to express less intention to quit. In addition to the indirect effect of personality through job satisfaction, there is evidence of a direct effect of personality on intention to quit. More extraverted employees and more neurotic employees are both more likely to say they plan to quit.
A More Careful Plain Language Summary
There is evidence that personality is connected to job satisfaction. More extraverted employees express more satisfaction on average, while more neurotic employees tend to express less satisfaction. More satisfied employees tend to receive higher performance evaluations. While personality may be related to job performance indirectly through job satisfaction, there is no evidence of a direct link between personality and job performance.
Naturally, employees who are more satisfied with their jobs tend to express less intention to quit. There is also evidence of a direct connection of personality to expressed intention to quit, with more extraverted employees and more neurotic employees both being more likely to say they plan to quit.